The Myth of Market Leadership
Why Today’s Winners Rarely Stay on Top
by Nico Meyer-Rogge, CFA
When people picture stock-market success, they picture a steady giant — Google, Amazon, Nvidia — compounding quietly forever. The real distribution of returns is far more brutal, and far more interesting.
Market gains are driven by a tiny, constantly-changing handful of stocks. Today’s household name peaks, loses momentum, and slips behind the index faster than almost anyone expects. Which means building wealth by hand-picking winners is a game where the math is quietly working against you.
1. The short life cycle of market darlings
Investors routinely take recent performance and draw a straight line into the future. When a company owns the headlines, it feels untouchable. History disagrees — leadership rotates, and “excess returns” fade fast.
The dot-com boom (1990s): Cisco and Intel were treated as permanent foundations of the future economy. After the 2000 crash, it took Cisco more than two decades to reclaim its peak; Intel still hasn’t. Others vanished entirely.
The financials run-up (2000s): Going into 2008, bank stocks were the engine of global markets. Post-crisis, many never reclaimed their old highs relative to the broader market.
Even today’s giants: Outperformance is fleeting even at the top. While Nvidia’s AI rally grabs attention, a former “untouchable” has already lagged — over the five years to October 2026, Amazon returned ~53%, well behind the S&P 500’s ~77% total return over the same window.¹
The lesson: a company can be wildly successful as a business and still trail as a stock.
Figure 1 — Amazon vs. the S&P 500, 5-year total return (source shown on chart).
🤓 THE NERDY INSIGHT — why “average” is sneaky
Wall Street loves the word average — and it’s hiding something.
Picture nine schoolteachers in a diner, each earning sixty grand a year. Average salary: sixty grand. Honest number.
Now a hedge-fund manager sits down — he made five billion last year. The “average” income in that diner just rocketed to five hundred million dollars. Technically everyone’s a half-billionaire. Realistically, nine people still make sixty grand and are splitting the fries.
That jump is the mean — one giant number dragging the whole room up. The median is the person in the actual middle seat: still sixty grand, still real.
So when you hear “the average stock returns 10%,” picture the hedge-fund manager. A few giants do the lifting; the typical stock is splitting the fries.
2. The harsh math: skewness and stock mortality
The distribution of stock returns is deeply lopsided. The market goes up; most of its members don’t.
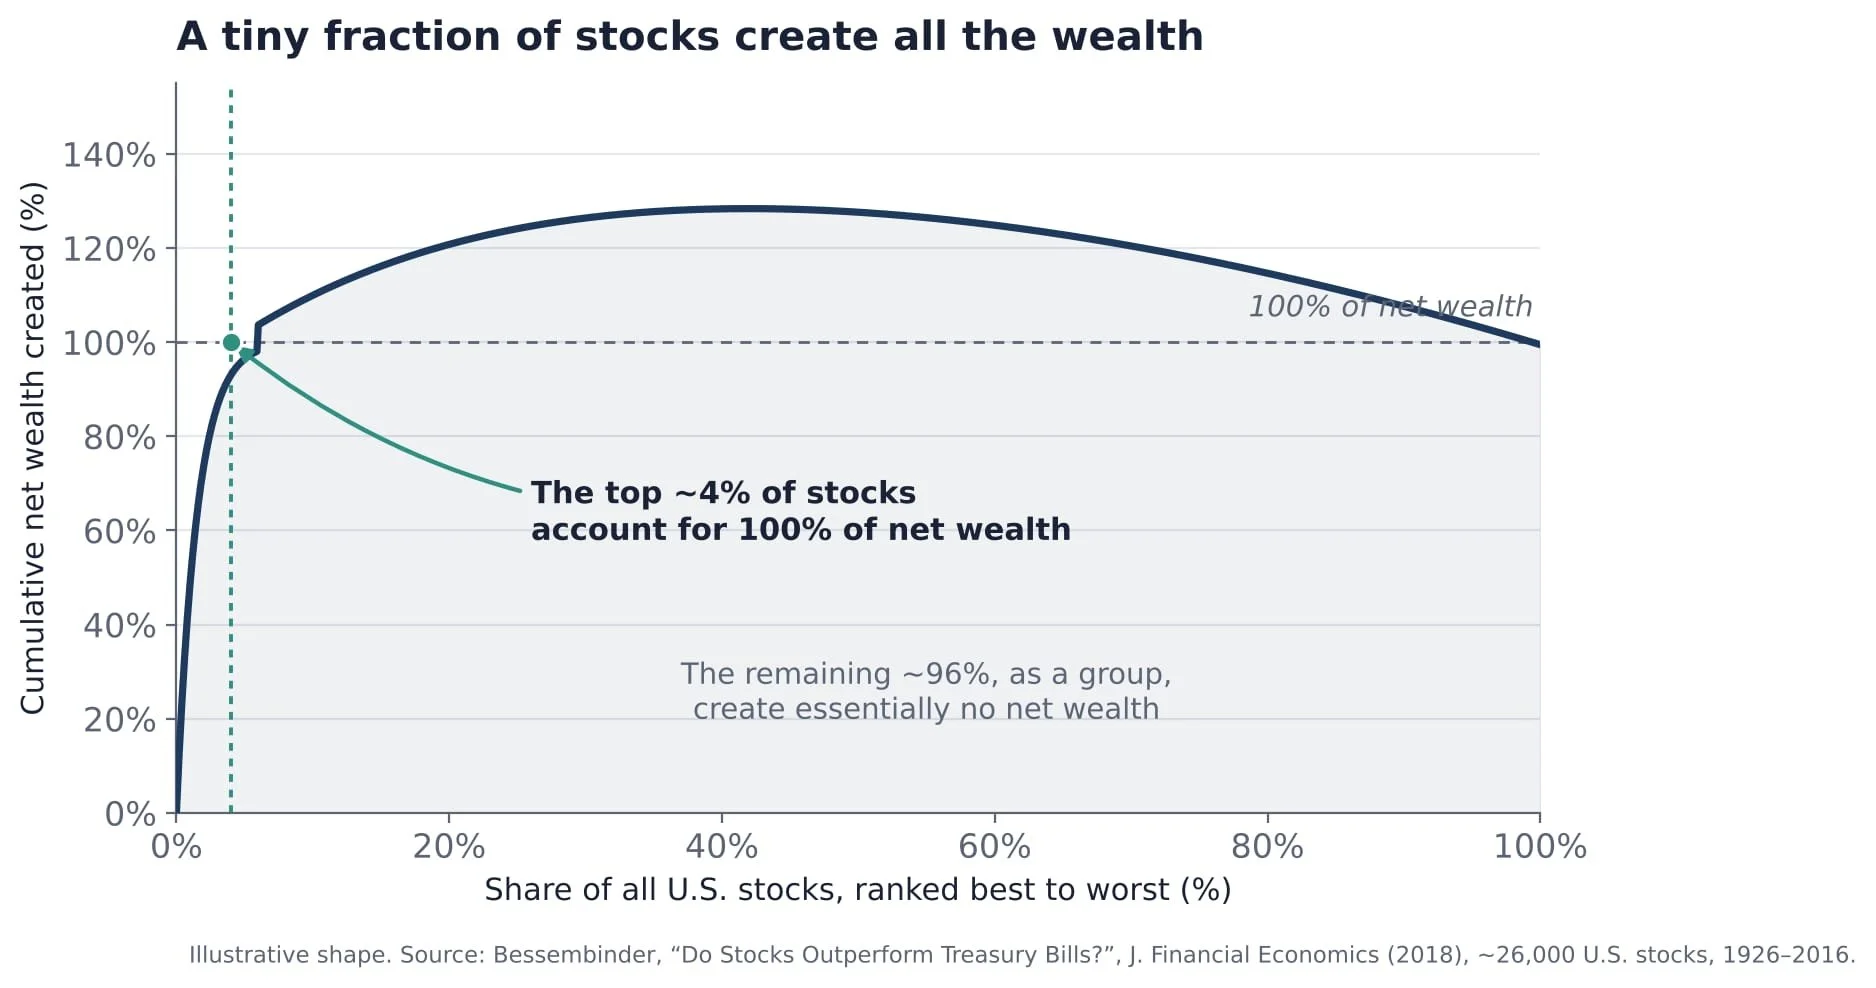
Figure 2 — Cumulative net wealth creation across all U.S. stocks (illustrative; source on chart).
| U.S. equity wealth creation, 1926–2016 (CRSP) | Outcome |
|---|---|
| Top ~4% of companies | Generated 100% of the market’s net wealth creation |
| Remaining ~96% | As a group, created essentially no net wealth |
| Median stock, lifetime | Negative |
1926 is the start of the CRSP database — the gold-standard record of U.S. stock history.
Landmark research by Professor Hendrik Bessembinder (Arizona State) analyzed nearly 26,000 U.S. common stocks in CRSP:
The ~4% rule: Just ~4% of stocks generated 100% of the net wealth the U.S. market has created.²
The 96% majority: Everyone else, as a group, created essentially none.
Survival isn’t guaranteed — but “gone” isn’t always “lost”: Many companies eventually leave the market. Some fail outright and wipe their shareholders out; others are acquired or taken private, where shareholders are usually paid — sometimes at a premium. The catch is you can’t reliably tell which is which in advance.
And outright failure is common. J.P. Morgan’s Agony & Ecstasy study found that roughly 40% of all Russell 3000 stocks since 1980 suffered a “catastrophic loss” — a 70%+ fall from peak they never recovered from.³
🤓 THE NERDY INSIGHT — “positive skewness” in plain English
“Positive skewness” sounds like a posture problem. Here’s what it means for your money.
Buy one stock and the worst case is −100% — you lose the lot. That’s the floor, and it’s fixed. The ceiling, though, is open-ended: every so often a company goes up not 100%, not 1,000%, but fifty thousand percent.
So the market is mostly small, quiet losers plus a couple of absolute giants — and those few giants pay for all the duds, with room to spare.
Buy stocks one at a time and you’re buying scratch cards, hoping you grabbed a giant. Buy the whole index and you own the shop — every winner included, no guessing required.
3. What this means for you
Two non-negotiable conclusions follow.
Own the haystack — stop hunting the needle. Because the gains hide in a tiny, shifting few, missing just a handful of top performers wrecks your long-run return. A broad total-market index fund (e.g., VTI or VT) means that as tomorrow’s leaders emerge, you already own them — no forecasting required.
Treat single stocks — and your employer RSUs — as speculative bets. Vested company stock is still a single stock, carrying large, uncompensated risk.
Cap the exposure: keep any single-stock position under ~10–15% of your invested assets — the overconcentration threshold used by major wealth managers (some stretch to 20% if you’re restricted from selling).⁴
Automate the exit: set a standing sell schedule as equity vests, and sweep the proceeds straight into low-cost index funds — converting a temporary, concentrated bet into permanent, diversified wealth.
— Nico Meyer-Rogge, CFA, is the founder of Finance Coach Meyer-Rogge, bringing institutional-grade risk discipline to individual investors. financecoachmeyer-rogge.com
References
Trailing 5-year total returns as of 2 October 2026: AMZN +53.2% vs. S&P 500 +77.3% (Yahoo Finance). Over 3- and 10-year windows Amazon has outperformed the S&P 500; the 5-year window includes its 2022 drawdown.
Bessembinder, Hendrik, “Do Stocks Outperform Treasury Bills?”, Journal of Financial Economics 129(3), 2018.
Cembalest, Michael, “The Agony and the Ecstasy: The Risks and Rewards of a Concentrated Stock Position,” J.P. Morgan Eye on the Market, Special Edition, 2014 (updated 2021).
Single-stock concentration thresholds: J.P. Morgan Private Bank, “Worried you may own too much of one stock?”; Charles Schwab, “How to Avoid Overconcentration.”